



A few years ago, we covered a limo van with 42-branded magnets and parked it outside the SaaStr conference. Total spend was around $2k, at a conference where the booths inside were running for up to $250k. Someone called it a ‘drivable booth’, which was pretty apt.
We also paid someone a couple hundred dollars to pass out flyers at the entrance. Which went well…until security removed her on day two.
And I knew the guerilla strategy was working when Emily Kramer sent me a photo of the limo. Not a lead, not a UTM. A photo, taken by someone I’d want to reach, of our drivable booth.
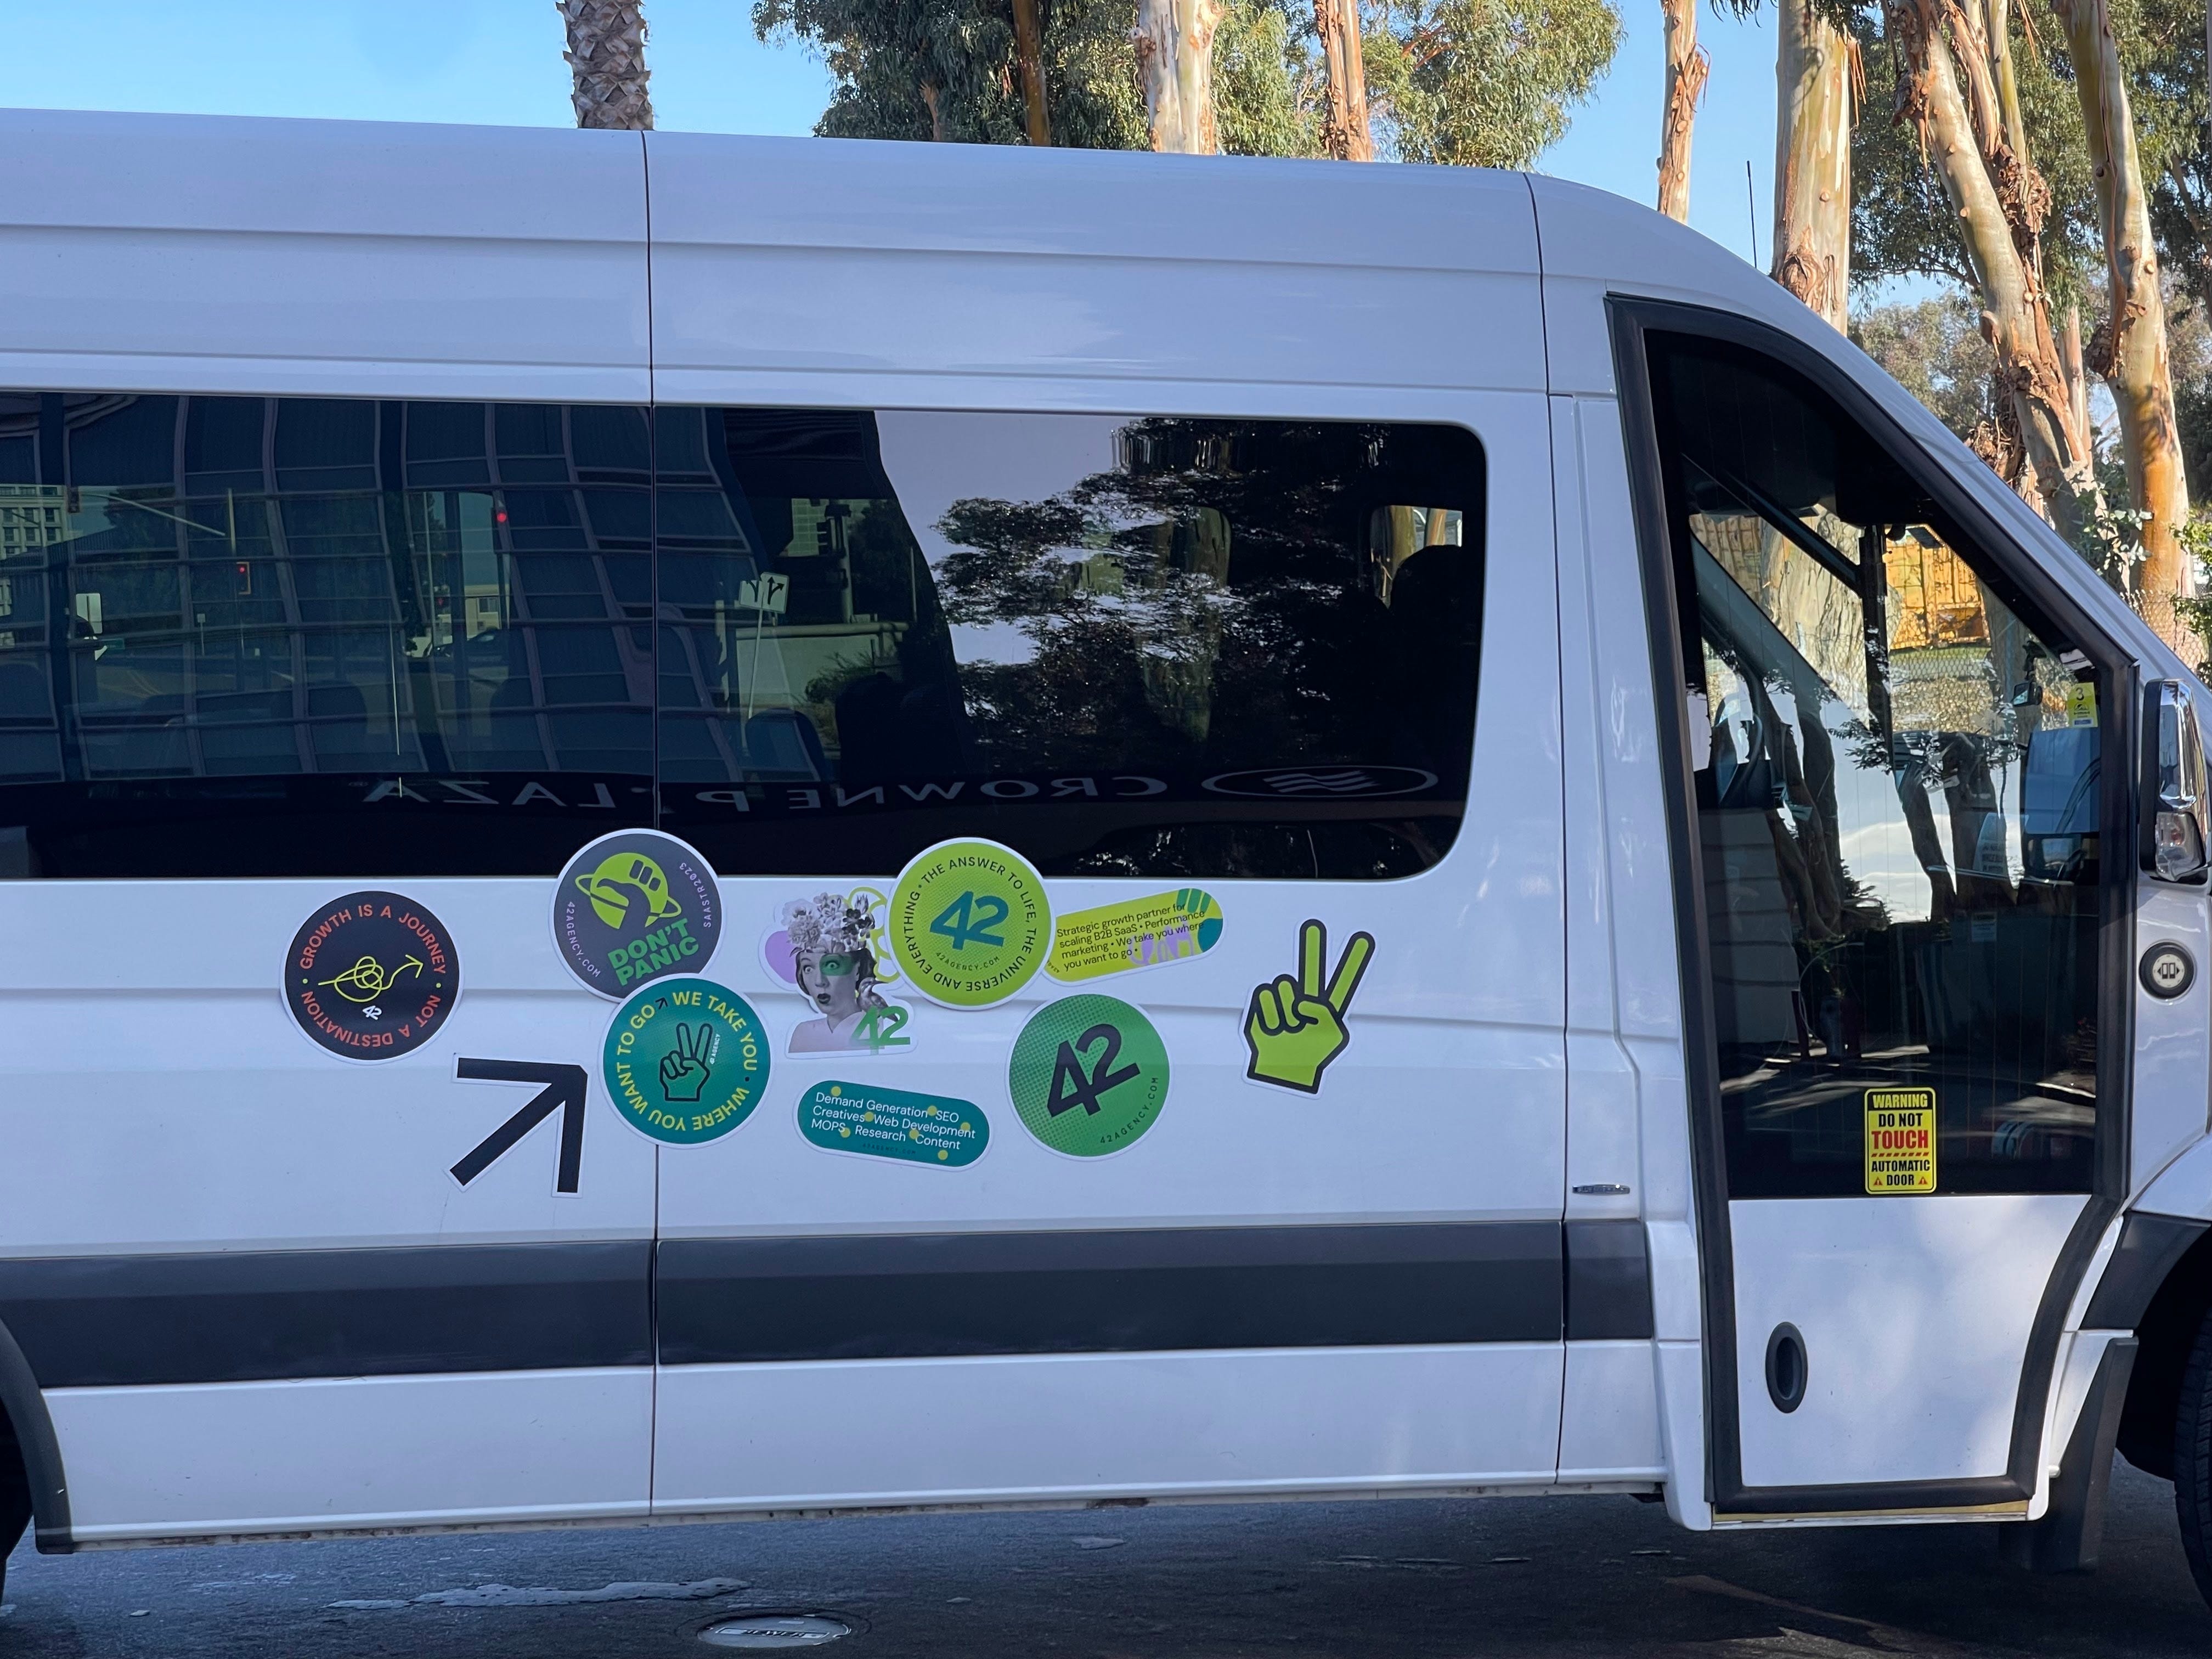
That was by far the best money we spent that quarter. Can I prove that? Absolutely not. No sourced pipeline. No attributed revenue. Nothing I could put in a spreadsheet next to our paid search numbers.
Which is the problem with a whole category of channels right now: podcasts, OOH, conferences, CTV. These channels are how you build a brand, but they don’t produce receipts. Which usually leads teams to respond in one of two bad ways.
Here’s we measure them.
This is not a permission slip
The fastest way to lose any argument around attribution is “trust us, it’s working.” I’m not saying that. If you can’t produce evidence a channel moved a needle, kill it. Marketing has spent twenty five years funding channels nobody could defend, then acting surprised when they got cut.
What I’m arguing against is more specific. You can’t demand the wrong evidence, then drawing a flawed conclusion.
How we approach it is that we hold these channels to the same standards we hold paid search to. Did the number I said would move, move? And did it move in the window I said it would move in? That’s a real bar you can measure with.
Two failures in opposite directions
What I tend to see is two failures:
Failure one: A team buys a podcast slot and asks for a promo code redemption rate. Or buys a conference booth and asks which pipeline it' sourced. Or buys CTV and asks for CTR.
By their nature, these channels are structurally incapable of giving you these numbers. Not just bad at it, but incapable. You can’t click a billboard while driving, just like you can’t click a podcast while you’re out for a jog.
Failure two: This one’s worse. The team goes through failure one, learns from it, but then overcorrects. This is how teams land on “brand is unmeasurable”. Which feels like a sophisticated logic for about six weeks, until the month two QBR arrives and the CFO asks about the return on spend.
In this situation, you’re not dealing with weak evidence, you’re dealing with no evidence. Not because it’s not possible to prove, but because nothing was set up to produce the evidence. Because of this, the spend dies. Deservedly so, because in a case like this, “unmeasurable” just reads as “unaccountable” from the other side of the table.
The teams who get their brand budget renewed (or even increased) aren’t the teams with better attribution. They’re the teams who actually wrote down how they’d measure success before anything gets turned on.
The biggest spenders in B2B already stopped pretending
We recently mapped B2B podcast sponsorship to see who is actually buying it, and how. Monday.com runs 11,896 detected podcast ads across 1,720 shows. And about 72% of those are pre-recorded slots dropped into whatever inventory was available.
That’s nearly twelve thousand ad placements across seventeen hundred shows, for just one product.
The majority of these (by quite some distance) are pre-recorded. Which means these placements aren’t hand-picked per show. They’re bought as reach. And there’s just no way someone is matching those 1,720 shows against sourced pipeline in Salesforce.
Monday.com aren’t an isolated example, either. Vanta runs 3,749 ads across 650 shows, with half of those host-read.
These are two large heavily scrutinized software companies that are buying huge amounts of unattributable reach. They wouldn’t do that if they didn’t know it was worth their while. They’re just measuring success in a different way.
The step everyone skips
Before a single ad runs, or the booth ships, or the first host read drops, freeze 30 days of pre-launch numbers. Make a note of branded search volume, branded impressions, direct traffic, and baseline organic. Write them down so you can easily come back to them.
That’s the critical step. That’s the mechanism for measuring these activities. It only takes a few hours, but pretty much everyone skips it.
But when you skip this step, you permanently lose the ability to make the case for that channel. Every number you can pull out later is missing a reference point. "Direct traffic was 4,100 last month" means nothing. But "Direct traffic was 4,100, almost double the pre-launch baseline of 2,200" is an argument.
Sure, baselining isn’t especially fun or sexy. But you’ll be so grateful you spend that time pulling Search Console exports when eight weeks later you’ve got to justify and defend that campaign.
We’ve now done this across conference, OOH, and podcast for more than one client. And the difference between whether the spend survives or not has nothing to do with the creative. It comes down to whether or not somebody locked the baseline in week zero.
The four signals we watch after launch
Once the baseline is locked, we track four things. Only four.
UTM-direct: Vanity URLs, podcast-specific landing pages, QR codes on the OOH placement and the booth. This will undercount badly and that’s fine. Most people hear a URL and then Google you anyway. It’s a floor, not a measurement.
Branded clicks: Search Console, branded query set defined before launch so nobody expands the definition mid-campaign to make the number look better.
Branded impressions: More sensitive than clicks and it moves earlier. When a channel starts working, impressions on your brand terms rise before clicks do, because people are searching you and then not needing to click through.
Direct traffic: The crudest one and often the most honest. Someone heard your name somewhere they can’t click and typed it in.
Four numbers, each against a locked pre-launch baseline, read monthly.
What we deliberately don't count
There are numbers that tend to go up with spend, without proving impact on demand:
Follower growth
Engagement rate
Video views
Booth scans
Impressions (reported as a raw number with no denominator)
Putting these numbers in a QBR deck is a great way to teach your CFO that brand reporting is theatre. Which is a lesson you’ll quickly regret.
The longer horizon: Share of Model
The four signals are your quarter-to-quarter scoreboard. But the real question that underpins everything is much slower, but more important:
Are you the default answer in your category?
We measure this as Share of Model. How often are you getting named in AI answers when someone asks a category question, branded search volume against your competitors, Search Console position on category questions, and competitor curves in Google Trends compared to yours.
A podcast campaign won’t touch this within a month. But if you see no change in your Share of Model after a year, you’ve got a pretty clear answer.
Share of Model also tells a wider story than most metrics. Traffic numbers only paints a small picture that only includes your brand. Share of Model paints a wide landscape where you can see where you stand compared to your competition.
Brand is a relative game. And being the default answer is inherently relative.
Why the clock has to be quarters
The 95:5 rule is a marketing cliché, but it’s still a fair assumption that whatever the ratio is for your category, most of your market is not currently buying. So a channel targeting that group won’t show up in this quarters reporting. And probably not next quarters, either.
So it’s important to keep this sentence in mind, and repeat it to anyone who will listen:
This spend is aimed at people who won't buy in this window, so here’s what we’ll look at instead, and how we'll judge it.
If you say this enough in week zero, you’ll get a fair hearing in month two. But if you say it for the first time in month two, it’s just an excuse.
What this looks like when it works
You were never going to have attribution by the end of the quarter. That’s just not possible for these channels.
But what you do have is four numbers you can compare against a pre-launch baseline, a defined brand query set nobody’s moved, a measurable Share of Model, and a horizon everyone agreed to before a penny was spent.
This isn’t proof, but it is evidence. Evidence from every channel that can’t be clicked, that tells you enough to know which channels to keep funding, and which to kill.
The SaaStr limo never showed up in any of our dashboards. We couldn’t prove it did anything. But it did show up in a photo from an industry peer we hugely respect, and it did appear in the numbers we’d written down the month before.
Share of Model needs the week-zero baseline most of all. The same question can name you in one answer and leave you out of the next. So a single run per question makes a shaky baseline. I'd lock it the same way you lock the branded query set. Fixed wording, written down before launch, several runs each.