


The Forecast That Looked Perfect

Every B2B marketer has seen it.
The neat little spreadsheet where every dollar of paid media scales in a straight line:
💰 $100K in → 📈 $800K pipeline out.
So $200K in → $1.6M pipeline.
Easy.
I’ve been in those meetings. The models look airtight. Finance loves them. The board nods along.
And then the campaign runs.
Spend doubles. Pipeline doesn’t.
By month three, the curve flatlines completely.
Not because the media team failed. Not because the ads didn’t run. But because the model itself was broken.
The truth is: pipeline in B2B does not scale linearly. It bends.
The Mirage of Linear Growth
Linear scaling works in consumer markets. If you sell toothpaste, adding budget really does just buy more reach.
But in B2B, you’re not selling toothpaste. You’re selling to a finite, specialized audience who only buys occasionally, in cycles, often with ten other people in the room.
The first dollars you spend are your best dollars. They hit:
In-market accounts.
Buyers actively researching.
ICPs already problem-aware.
But once you saturate that group, the math changes.
The next dollars don’t go to more in-market buyers (there aren’t any left). They go to:
Adjacent personas.
Accounts that fit ICP but aren’t ready.
The same VP of IT who’s already seen your ad six times this week.
That’s the diminishing returns curve. And if you don’t account for it, your forecasts are already wrong.
How We Model the Curve
When we forecast for clients, we don’t stop at “$1 in = $X out.” That’s only the first step.
We build models in layers:
Step 1. Establish the Baseline
Start with real MoM data: Spend → MQLs → SQLs → Opportunities → Pipeline.
From that, we derive a baseline efficiency — pipeline-per-dollar at current spend. This gives us the linear model. Useful, but naive.
Step 2. Measure the Ceiling by Channel
Here’s where it gets interesting.
Search (Google/Bing):
The ceiling is hard-coded in query volume. If there are only 5,000 relevant monthly searches for your category, no amount of budget will make more people search. Once you max impression share, you’ve hit the ceiling.
LinkedIn Ads:
We map TAM by account list and persona, then overlay:
3rd-party intent signals.
1st-party intent (website visits, product interest).
Buying signals like open roles tied to the problem you solve.
This defines your “addressable universe” and the frequency at which you can show up before fatigue sets in.
Programmatic & Display:
Looser targeting, but the ceiling is tolerance: how much spillover outside ICP are you willing to pay for before pipeline-per-dollar collapses?
Step 3. Layer Brand & Qualitative Signals
The most overlooked step.
Pipeline isn’t just math — it’s memory.
A company with strong brand recall will convert impressions to pipeline at a higher rate. A company with weak recall will struggle, no matter how targeted the spend.
We’ve run brand recall surveys where only ~20% of ICP respondents said they were “very familiar” with a company. Many said “heard of the name, not sure what they do.” That number is effectively a ceiling: you can’t expect efficient pipeline until familiarity shifts.
A Forecasting Exercise
Recently, we ran a forecasting exercise for two mid-market SaaS brands in adjacent industries.
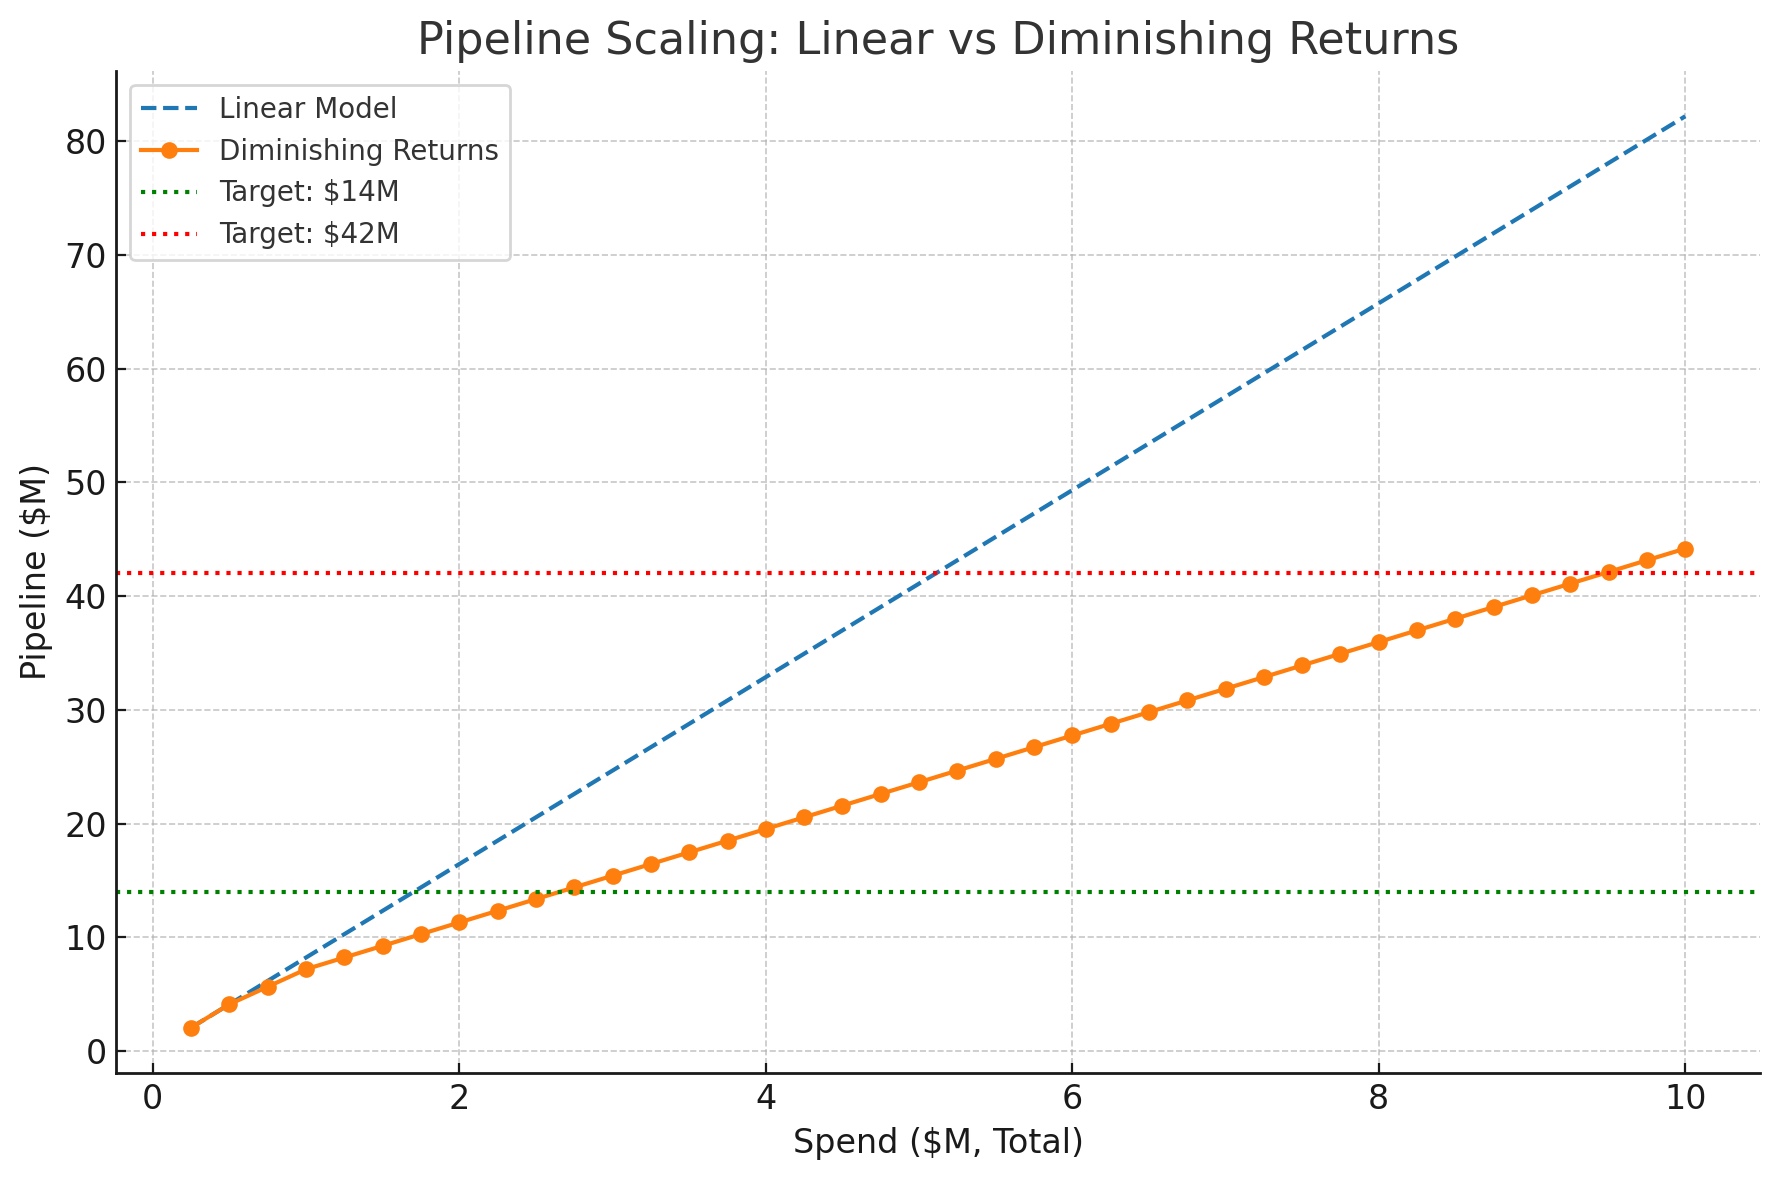
When we applied the linear model, the math said:
~$1.7M spend (over 4 months) could generate ~$14M pipeline.
~$5.1M spend could generate ~$42M pipeline.
On paper, it looked achievable.
But when we ran the diminishing returns model — tiering efficiency down after the first $500K/month — the curve collapsed:
$1.7M delivered closer to ~$10M, not $14M.
$5.1M delivered closer to ~$24M, nowhere near $42M.
The lesson wasn’t “don’t spend.” It was:
Know where the curve bends.
Plan for diminishing returns.
Treat later spend not as immediate pipeline, but as future demand creation.
That subtle shift — from pipeline math to demand strategy — changes the whole conversation with leadership.
Brand Recall in the Wild
Here’s another lens.
We ran a recall survey for decision-makers in one market. The results?
Only 22% were “very familiar.”
38% were “somewhat familiar.”
The rest had either just “heard the name” or “not familiar at all.”
That’s a ceiling.
Until you grow the “very familiar” segment, pipeline efficiency will be capped, no matter how much you spend.
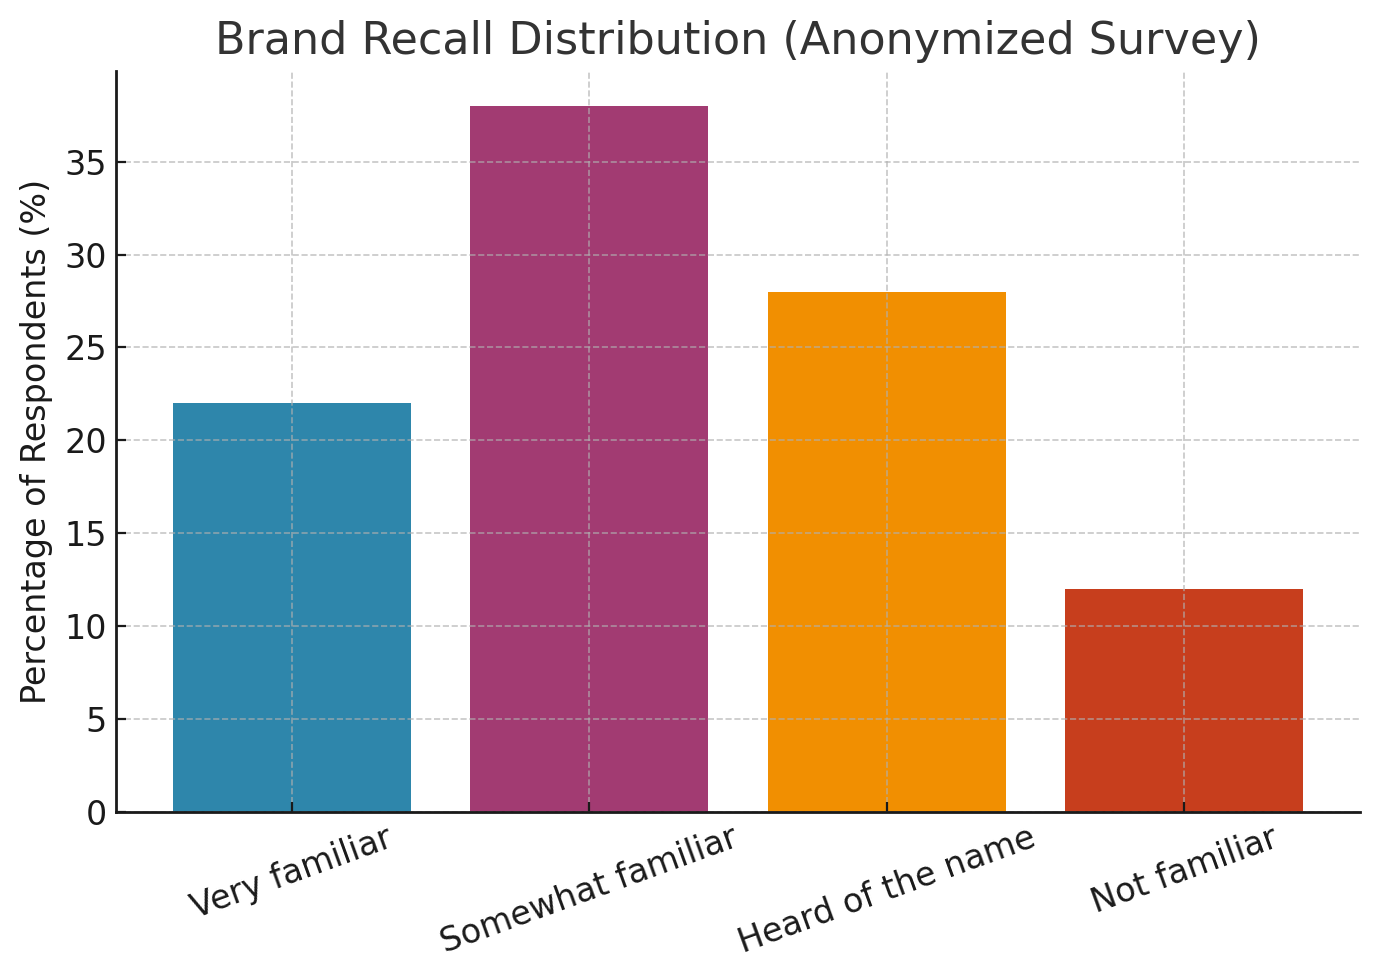
Visual 2: Brand Recall Distribution
This is where brand and demand intersect. Paid media doesn’t just capture demand — it creates mental availability. And that availability is measurable.
The Second-Order Effects
Here’s the part that rarely makes it into a forecast deck: second-order effects.
We ran campaigns for an enterprise software company. During the flight, branded organic search spiked — materially. People weren’t just clicking ads; they were Googling the brand.
That’s demand creation at work. Paid didn’t just produce direct conversions. It nudged memory, which showed up in search volume.
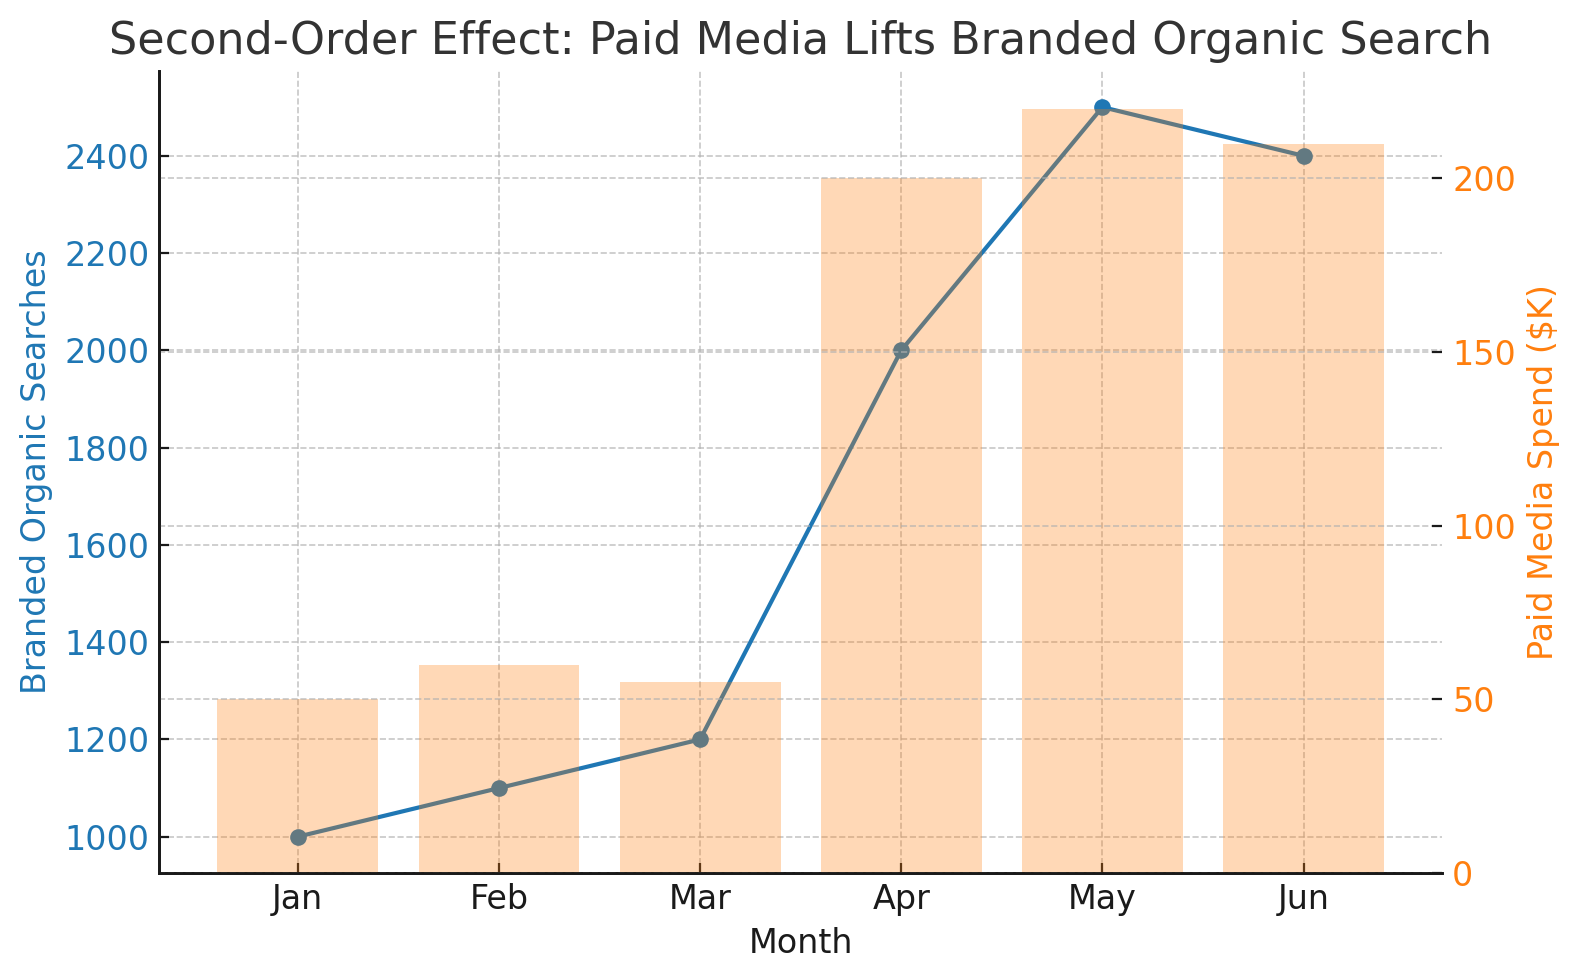
Visual 3: Paid Media Spend vs. Branded Search Lift
(Drop in the second-order effects chart here)
When you ignore second-order effects, you undervalue paid media.
When you only count direct pipeline, you miss the compounding.
Why This Matters
Because your CFO is going to ask: “If $1 in gets $X pipeline, why don’t we just spend 10X?”
And your job is to explain the curve:
Early dollars = capture.
Later dollars = creation.
Every channel has a ceiling.
This isn’t about underselling paid. It’s about reframing it.
Paid media is not a faucet you can just turn up. It’s a curve. And unless you map the curve — with ceilings, brand recall, and second-order effects — you’re driving blind.
Closing
The most dangerous assumption in B2B marketing is that growth is linear.
It’s not.
It curves.
And great marketers don’t just spend more.
They forecast the plateau. They measure the ceiling. They use brand and qualitative insights to expand it.
That’s the work.
Because the question isn’t “How much pipeline will $X get us?”
The real question is: “Where does the curve bend — and what do we do next?”